Streamline Your Data Using Pivot Tables
Pivot tables are a simple and powerful way to analyze and summarize large sets of data. With a few simple clicks, you can aggregate hundreds or thousands of rows of information into meaningful insights. Here’s a step-by-step guide on how to create a pivot table in Excel.
Step 1: Organize Your Data
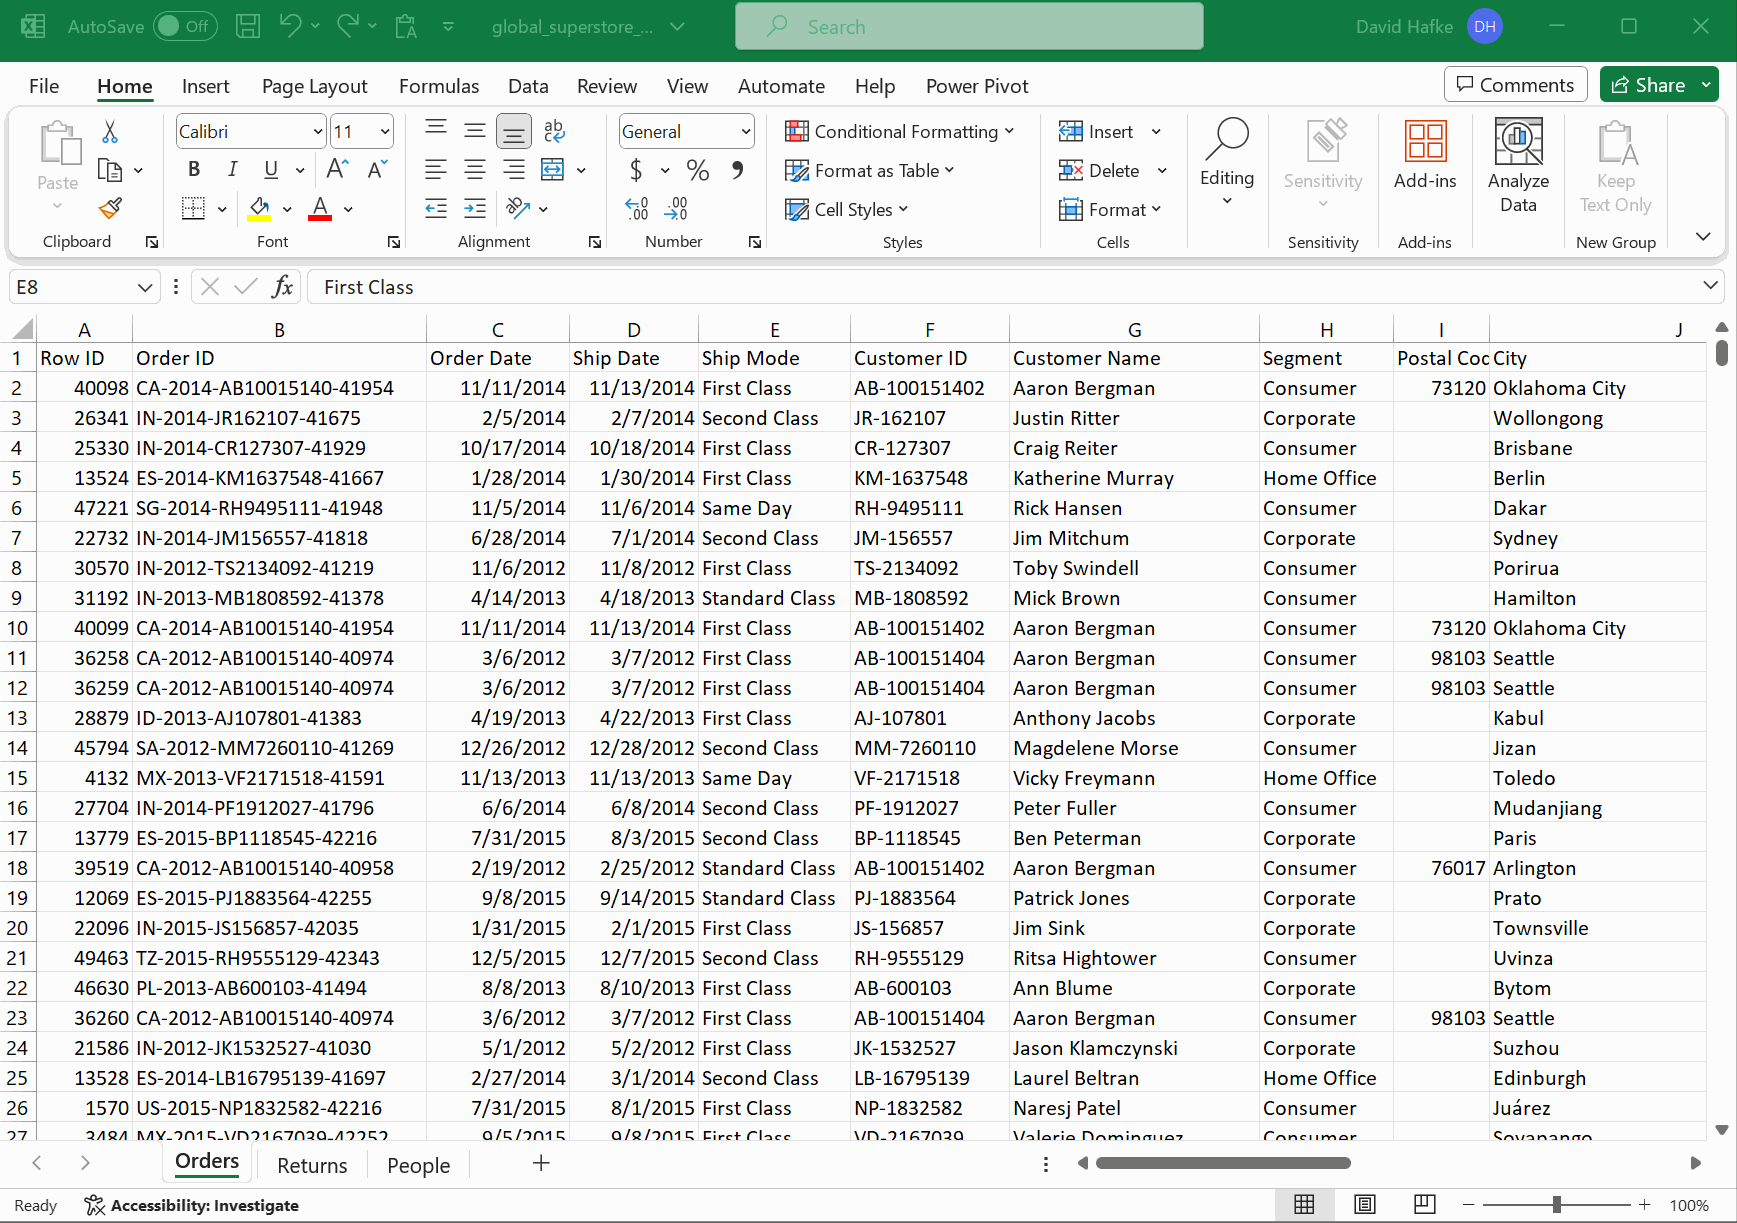
Before creating a pivot table, ensure that your data is organized in a tabular format. Each column should have a clear header up top and the appropriate data fields underneath. We suggest breaking multiple types of data into separate fields. For example, City and State allow more search options than ‘City, State’ in one field.
Step 2: Select Your Data
Click on any cell within your dataset. Excel will automatically detect the range of your data. If it doesn’t, you can manually select the data by dragging your cursor over the cells or by using keyboard shortcuts like those listed below:
- CTRL+SHIFT+arrow: Extend the selection to the last nonblank cell in the same column or row as the active cell
- SHIFT+HOME: Extend the selection to the beginning of the row
- CTRL+SHIFT+HOME: Extend the selection to the beginning of the worksheet
Step 3: Go to the Insert Tab
Navigate to the “Insert” tab from the top ribbon. Then select the “PivotTable” option.
Step 4: Choose Your Data Range
There are several options in the “Create PivotTable” dialog box to adjust the source range or the destination of the table, but generally you will only need to click OK.
Step 5: Design Your Pivot Table
Your blank pivot table will appear in a new worksheet. On the right, you’ll see the “PivotTable Field” pane. Select the fields you would like to organize from your dataset, such as company name or geographic location, and they will auto populate in the Rows and Columns areas. You can drag and drop fields between different areas (Rows, Columns, Values, Filters) within the “PivotTable Field” pane to rearrange the table layout for different views.
Step 6: Add Values
Select the fields you want to aggregate to populate the “Values” area. Excel will automatically suggest a sum or count function based on the data type. You can change this by clicking the drop-down arrow next to the field in the “Values” area and selecting the desired function (sum, average, count, etc.)
That’s all there is to it! You are now able to review and analyze your data in a much more convenient way. Consider adjusting the formatting or adding filters to make the table more readable and accessible. Also keep in mind that if the source data changes, you will need to manually refresh the pivot table by clicking “Refresh” on the “PivotTable Analyze” tab on the ribbon. This ensures your pivot table reflects the most recent data.
Creating a pivot table in Excel is a valuable skill that can significantly streamline data analysis and decision-making processes. With the above steps, you can turn a large dataset into a comprehensible and insightful summary with minimal effort.